Amplitude voltage of alternating current. Vector image of sinusoidally varying quantities. The effective value of alternating current
When calculating AC circuits, one usually uses the concept of effective (effective) values of alternating current, voltage, and e. etc. with.
Current values of current, voltage and e. etc. with. are denoted by uppercase letters.
On the scales of measuring instruments and technical documentation, the effective values of the quantities are also indicated.
The root-mean-square value depends on the peak value and shape of the waveform. The value can also be determined graphically by the method of counting surfaces. The square root is taken from the value defined in this way. The following figures show examples for determining the rms value of non-informational periodic signals.
For a signal of a rectangle symmetric to the zero axis, the result is obtained by the following consideration. The voltage polarity and the resulting current are indifferent to the power converted during the resistance. In this rectangular signal, the absolute voltage value is always present. This value is equal to the derived rms value. The following example of a square-wave mixing voltage provides the same rms value as a sinusoidal voltage symmetric to the zero axis.
The effective value of the alternating current is equal to the value of such an equivalent direct current, which, passing through the same resistance as the alternating current, releases in it the same amount of heat over a period.
The amount of heat allocated by an alternating current in the resistance for an infinitesimal time interval
![]()
The triangular signal can be divided into separate sections of functions with positive and negative slopes. In the case of a symmetrical triangle, the individual parts of the surface are the same. This can be seen from the course of the curve, but it can also be shown by certain integrals. Therefore, to calculate the root-mean-square value, it is necessary to integrate through the first section of the curve and multiply by 4.
Crest factor or crest factor
The following conclusions show that the rms voltage for sawtooth signals is identical to the root-mean-square value for triangular signals. The ratio of the peak value to the effective value of the signal is referred to as the peak or comb coefficient and has the formula ξ. The coefficient is determined by the waveform and is greater than or equal to. For sinusoidal signals, the ratio of the ridge has the value √2 = 1.
and for the period of the alternating current T

Equating the resulting expression to the amount of heat allocated to the same resistance by a constant current for the same time T, we obtain:
![]()
Lathe indicators always display the correct effective value of a variable variable, but only suitable for low frequencies. Coding coils with measuring rectifiers were initially calibrated to display the rms value of pure sinusoidal magnitudes. They record the equivalence or magnitude of the average signal value and include the form factor. The shape factor depends on the waveform, and the meter can only correctly display the waveform to which it is calibrated.
Measuring instruments with electronic calculation circuits can determine the rms value from different signals and, consequently, display the measured value correctly. Rectangular signals and other pulses with steep edges do not immediately reach their maximum values. The increase in flanks does not extend at a right angle to the time axis. Time passes, which can be represented on an oscilloscope with a suitable extension of the time axis. Some parameters are standardized and specially marked.
Having reduced the common factor, we obtain the effective value of the current


Fig. 5-8. Graph of alternating current and square of current.
In Fig. 5-8, the curve of the instantaneous values of the current i and the curve of the squares of the instantaneous values are plotted. The area bounded by the last curve and the abscissa axis is in a certain scale the value determined by the expression The height of a rectangle of an equal area bounded by a curve and the abscissa axis equal to the average value of the ordinates of the curve is squared current value
The following sketch shows all important notations. In the case of a nonlinear edge profile, the definition values are read from 10% to 90% of the signal amplitude. A positive edge is the leading edge. A negative side slope is a rear flank. The decay time is the time when a voltage or current impulse is required to decrease to 10% of its maximum value. The decay time is approximately proportional to the time constant of the circuit. In audio technology, the reverberation time is the reverberation time and depends on the frequency.
If the current varies according to the law of the sine,
![]()


Similarly, for the effective values of sinusoidal stresses and e. etc. with. you can write:
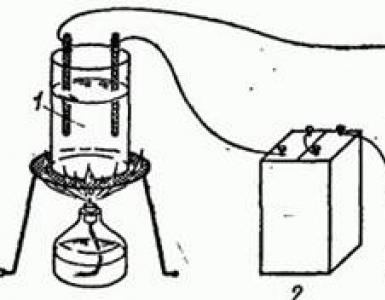
In addition to the basic generation of a sinusoidal signal, the most important characteristics of sinusoidal signals are described under this name. According to the rules of magnetic induction, a voltage is generated at the terminals of the coil rotating in a magnetic field. To get a relationship here, the coil is reduced to a conductive loop. It rotates at a constant speed in a uniform magnetic field, so that changes in the rotation angle remain unchanged at the same time intervals.
The contour of the conductor covers the plane in the plane. If the contour of the conductor rotates, the surface size decreases with respect to the direction of the magnetic field. The effective area is now the projection of the rotated surface onto the plane. Accordingly, the magnetic flux Φ decreases.
In addition to the current value of current and voltage, sometimes use the concept of mean value of traffic and voltage.
The average value of the sinusoidal current for the period is zero, since during the first half of the period a certain amount of electricity Q passes through the conductor cross section in the forward direction. During the second half of the period, the same amount of electricity passes through the conductor cross-section in the opposite direction. Consequently, the amount of electricity transmitted through the conductor cross section over a period is zero, equal to zero and the average value of the sinusoidal current over the period.
Both the active area and the associated magnetic flux are functions of the angle of rotation. The magnetic flux Φ enclosed in the conductor circuit changes with uniform rotation in accordance with the cosine function. The full round or period corresponds to 360 °. Direction of rotation on the electronics display diagram as agreed counter-clockwise. The change in the magnetic flux ΔΦ depends on the angle and time.
The stress is calculated, as follows from the law of induction. The result is a sinusoidal voltage at which the negative sign of the self-induction voltage is canceled. From the standpoint of a uniformly rotating conductive loop, the largest changes in the magnetic flux occur in the range 90 ° and 270 °, while the changes are insignificant only by 0 ° and 180 °. Flow changes are described by a cosine curve. The amplitude of the induced voltage reaches its maximum value when the maximum possible number of field lines is detected at the 0 ° and 180 ° position by the circuit.
Therefore, the average value of the sinusoidal current is calculated in the half-cycle, during which the current remains positive. The average value of the current is equal to the ratio of the amount of electricity that has passed through the conductor cross section in half the period to the duration of this half-period.
The values of the effective voltage and current. Definition. Ratio with amplitude for different shapes. (10+)
The relationship between a pointer and a linear chart
This corresponds to a sinusoidal curve. Representation of sinusoidal or cosine variable variables can be performed with the help of an index diagram, as well as with a linear diagram. In the next interactive film, the radius can be rotated counter-clockwise as a red pointer. The length of the pointer corresponds to the maximum value or peak values of the change variable. For each angular position in the circle, a rectangular triangle appears as the hypotenuse.
The concept of effective (effective) values of voltage and current
When we are talking about alternating voltage or current strength, especially a complex shape, the question is how to measure them. After all, the tension is constantly changing. It is possible to measure the amplitude of the signal, that is, the maximum of the magnitude of the voltage value. This method of measurement is normally suitable for signals of relatively smooth shape, but the presence of short bursts spoils the picture. Another criterion for choosing a measurement method is the purpose for which a measurement is made. Since in most cases the interest is represented by the power that a given signal can give, an effective (effective) value is applied.
The length of the green legs created by the perpendicular projection of the pointer to the horizontal pointer with φ = 0 ° is equal to the value of the amplitude of the cosine curve for the corresponding angle φ. The height of the solder from the tip of the pointer to the horizontal, the length of the blue vertical catheter is equal to the amplitude of the sinusoidal curve for this angle. In the section "Thematical Mathematics" detailed mathematical calculations can be read by the angular functions of a right triangle.
A linear diagram can be developed from a single circle using a rotary index. For this purpose, the circular circle along the zero line is folded to the right and, consequently, to the x-axis of the rectangular coordinate system. If the pointer rotates evenly after a full round, then this is a periodic operation.
Your attention a selection of materials: The effective (effective) value for signals of the standard formSine wave (sine, sinusoidal) [Actual value] = [Amplitude value] / [Square root of 2] Rectangular signal (square wave) [Actual value] = [Amplitude value] The period of a sinusoidal variable variable consists of positive and negative half-oscillations. Both quantities are mutually opposite to each other. The frequency of 50 hertz means that 50 periods pass in one second. Each period consists of a positive and negative half-wave. The period of full oscillation is 50th second and lasts 20 ms. In the linear diagram, the angle α, as well as the time, can be represented as an independent variable. After a while passes 360 °. Therefore, instantaneous values can also be calculated as a function of time. At a higher speed of rotation, the circumference of the circle and, therefore, the period pass faster. The concept of time is included in the peripheral speed. Triangular signal [Actual value] = [Amplitude value] / [Square root of 3] Ohm's law and power for the actual values of voltage and currentThe effective value of the voltage is measured in Volts, and the amperage in amperes. For effective values, Ohm's law is true: = / [ Load resistance, Ohm] The circumferential velocity depends on the radius. The ratio of the circular velocity along the radius is called the angular velocity. It is given as a sign of the formula ω, omega with unity -1. The angular velocity is the same for all points of the rotary index. The duration of a period can be replaced by a frequency. This gives the relationship of the angular frequency known in electrical engineering. Angular velocity is the angular change per unit time. The angle passed at a certain time is described by the following equation. If the peak value and frequency are known, the instantaneous value of the sinusoidal variable can be calculated for each time. [Power dissipation at ohmic load, W] = [The current value of the current, A] * [The effective value of the voltage, V] Unfortunately, the articles periodically encounter errors, they are corrected, the articles are supplemented, developed, new ones are prepared. Subscribe to news to be aware of. If there are several sinusoidal variable variables in the system, the phase angle is not available for unambiguous description in addition to the frequency and peak values. Two sinusoidal oscillations of the same frequency must shift in time with respect to each other. In the linear diagram, the blue curve has a negative amplitude value at φ = 0 °, and the red curve has a negative amplitude value. If these values are projected onto a pointer chart, then the corresponding pointers can be drawn, and the angular values of these amplitudes can be read. The reference angle or reference phase is 0 °. The phase angle of the blue curve is φ1 = 30 °. The phase angle of the red curve is φ2 = -45 °. These angles are called zero phase angles and depend on the control point. If something is not clear, be sure to ask! More Articles Microcontrollers are an example of the simplest scheme, an example of application. Fuses (... FET switching time. Capacitance of the shutter - drain, source .... The angle of phase shift is the difference of the angle of the zero phase, and independently of the common reference point. It calculates the absolute value of φ = 75 °. If the amplitude axis is shifted to the right of the green position, the blue curve starts from zero and becomes a control curve. At this time, the red curve has a negative amplitude. The corresponding angle can be read on the diagram of the pointer with φ = -75 °. Looking only at the linear diagram, the red curve reaches the amplitude value 0 after 75 °. The red line gives the blue reference curve in accordance with this phase angle, so the minus sign for the phase angle with φ = -75 °. Increasing pulse voltage converter. Power key - bipol ... Extension cord for remote control, doo, infrared, IR ... If, however, serve as the reference curve, the red curve, the amplitude axis moves to the light-blue position. The blue curve already has a positive amplitude, for which the phase angle φ = 75 ° can be read in the diagram of the pointer. In the linear diagram, the blue curve to 75 ° had a value of amplitude 0 with a positive slope. The blue curve is thrown on the reference curve, so the plus sign for the phase angle with φ = 75 °. The average value of the sine sizeIn principle, the relationships for work and power that are produced for a constant voltage are also applied to alternating voltage. Instead of constant values, it is now necessary to use the time-dependent values of voltage and current. At the same time, the voltage and current are in phase with ohmic resistance. The power curve of sinusoidal variable variables is also sinusoidal, but has a doubled frequency. In the time diagram, it is only in the positive range, since the result is always positive when two negative values are multiplied. Color music, color music equipment with their own hands. Scheme of the CMU, to ... Magnetic amplifier - design, formulas, calculation online (online) .... Push pull pulse voltage converter. Selecting a bipole key ... |